 Best Practices
Mozambique response benchmarks for RPM
Users of Molnix RPM have become comfortable with the new ways of mobilization. HR staff and roster members alike have been starting to respond faster and more accurately. How do we measure this and other key performance indicators of a roster? In this post we take a deep dive into some benchmarks of how our customers were able to optimize their response with Molnix RPM alerts during Cyclone Idai.
Defining response time
Rapid mobilization of staff is no easy task. Anyone working in global emergency response will agree, that many things need to happen before the humanitarian expert is en route to the disaster site. In this post, we are looking at the time from the organization alerting its roster members, to contracting them. We also have integrated secondment and cross-organization staff request mechanisms available for the steps preceding – let us know if you need that!
The KPIs
- Time to create an alert (page load to save)
- Time to send an alert (creation to send)
- Time to deliver an alert (send to delivery confirmation)
- Time to availability awareness – intelligent alerts only (delivery confirmation to response)
- Time to contract (page load to save)
As you can see, we are considering factors taking place within the RPM system itself. These factors we can measure reliably and are the points where our impact is the greatest.
Method and limitations
We are considering the time interval of 4 March 2019 until 3 May 2019 inclusive. It represents mobilizations starting just before the cyclone up until all first staff rotations are done for most of our customers. This is a rough interval as in this benchmark, we do not look at the actual content of customer’s rosters, only metadata.
For the page load data, we are considering sessions with a 5-minute cut-off as this was found to be about the bottom of a statistical valley. It helps us disregard non-urgent use cases. Think for example situations where an HR officer opens a contract form and leaves it open over lunch. The data is sampled at the web server (nginx) and analyzed by us manually.
For the send time data, we use first entries. In other words, we are not considering updated responses etc. The data is calculated at the database server (MySQL) and graphing is done automatically by Molnix RPM. In the database structure, we use datetime, which limits us to a 1-second resolution.
The results
1. Time to create an alert
As you may have heard, we pride ourselves with fast alerts. In fact, we promise that any alert can be done in 60 seconds. Looking at our data, I found that the fastest alert was done in 23 seconds!
This metric tells us how quickly our customers are able to get their alert out using RPM. It is effectively the work time used as well as a critical organizational response time.
73% of alerts were created with the intelligent mode. This tells us that the feature has been well received. We do not expect simple mode alerts to disappear, since they are still very useful for alerts that do not need a reply.
Overall, the average intelligent alert was created in just under 4 minutes. The same number for simple alerts is just over 3 minutes. There are more fields to fill in the intelligent mode and we should be able to justify that extra time with the benefits it brings.
The tail at around 12 minutes was held by intelligent alerts that also had the longest lengths. This tells us that they likely are more elaborate and use formatting in the information section.
2. Time to send an alert
As soon as you click send on the alert page, the messages start going out. The whole delivery chain for SMS and email has many components affecting speed and reliability. By nature, there will be variance that affects your alert. The first part is to ensure the message is sent successfully.
This metric tells us how well our system is performing internally, as well as the interface we use with various communications providers. There are certain sending rate limits depending on how the message goes out. This is a theoretical maximum of 10 messages per second for most customers. The first and last seconds usually see a ramp-up and ramp-down.
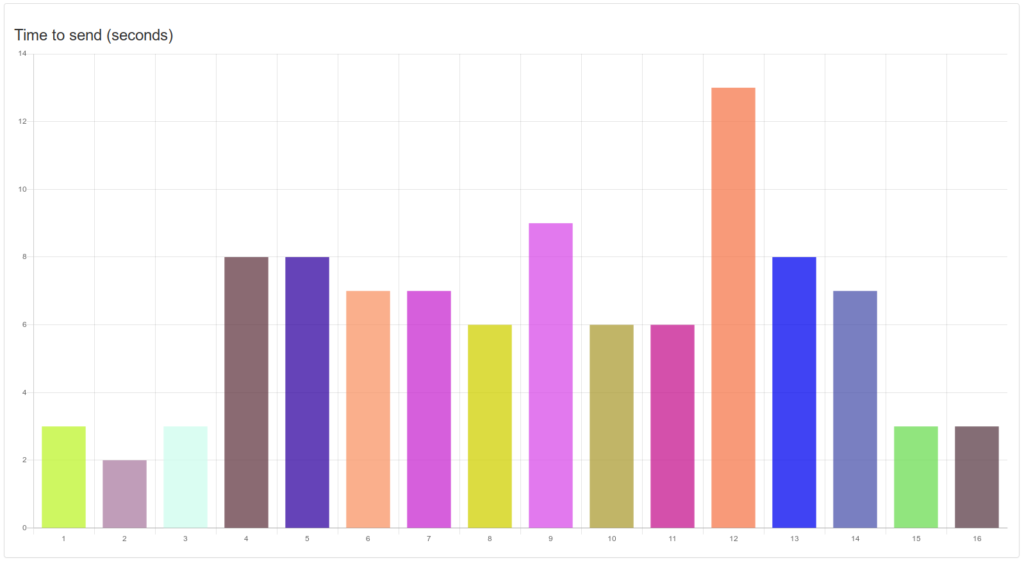
In typical cases, such as above, we are close to the maximum sending rate. There could be some gains in adding a gated send buffer to the queue. That said, for customers with very high volumes there are faster options available.
3. Time to deliver an alert
After a message is sent, it has to go through many routers, server and operators to reach its destination. While the specific performance is mostly out of our hands, making sure it works is still our responsibility to you.
This metric tells us how well our communications partners work. Please note that both email and SMS are best-effort services. This means there is no ultimate guarantee of the message reaching the recipient. That can only be provided by push our messaging and, indirectly, by intelligent alerts. It is important to note that this metric normally has a long tail due to phones being off or out of coverage, network glitches, email greylisting and so on.
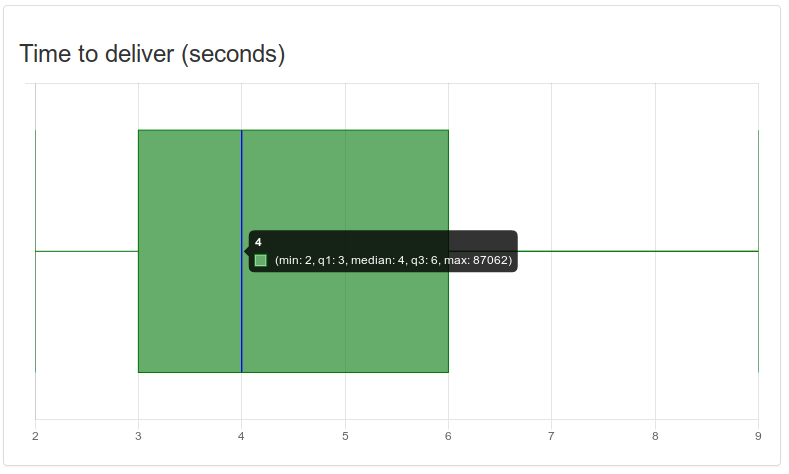
Message delivery metrics rely on operators, and again, results vary by country due to regulations and operator due to practices. In our tests, the majority of messages were delivered in between 3 and 6 seconds. The expected interval for any message is 2-9 seconds. In the screenshot above, you can also see “max: 87062” which is just over 24 hours. This is the typical maximum any SMS is kept in attempt to be delivered. Email delivery data is somewhat less reliable and less standardized. Email delivery notifications also only tell us that the user’s server has received the message, rather than the device it is eventually read on as with SMS.
Ultimately the statistics show us that delivery times are within expectations. This is well, since there is not much we could do about this except for using more push notifications. Ask us for the RPM mobile app if you are interested in free push alerts!
4. Time to availability awareness
Your roster members’ responses to you is the most human-dependent part of the alerting sequence. We see a lot of different types of data here, since each roster has its own rules regarding mobilization. Some have paid stand-by rosters, where responding is mostly a matter of acknowleding receipt. Others may use best-effort rosters that require a written absence approval from the permanent employer before confirming availability.
Ultimately, this metric thus tells us how well roster members respond rather than how RPM works. It is related to alert content, roster rules and more factors that are out of our control. At the same time, it is a very important metric to understand and improve alerts’ interactions. We use this metric to facilitate easier responding, and you can use it to set targets for your roster.
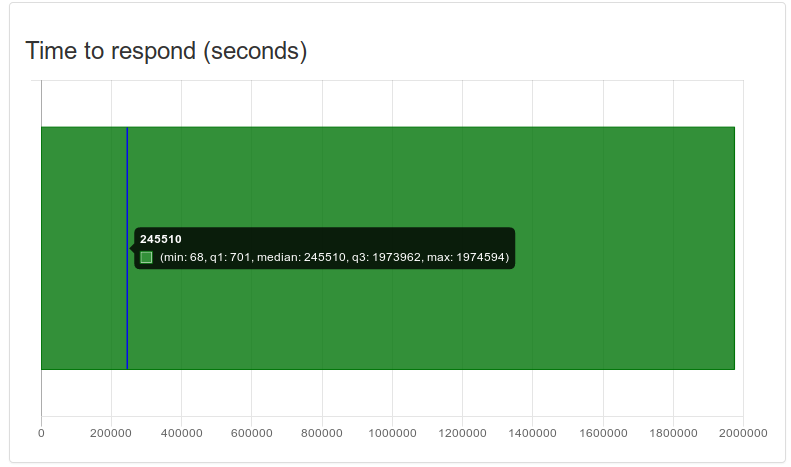
I picked an example with one of the broadest ranges for this case to illustrate. The first response comes in at 68 seconds – this is quite fast but not the fastest we have seen. The first 25% of the responses (q1) are in within 12 minutes. After this, responses start dropping in at an logarithmically decreasing rate. The median is at just under 3 days and the ultimate cut-off here is likely set by the alert validity time, after which it is no longer possible to respond.
The profile of the above graph is quite representative of most responses. The essential difference proves to be the alert validity time – a short validity inherently also keeps the responses tight. When your roster knows about your expectations, the response rates and times also improve. This we have seen as an effect over time after RPM and its alerts have been adopted and used.
5. Time to contract
Finally, like the first metric, we again look at how quickly our customers are able to use RPM to get people to be part of their operations after alerting and selections. In our internal tests, creating a contract is perfectly feasible in 60 seconds – as with alerts. However, there are more fields to fill, so I was unsure what we would find.
I was therefore very happy to see that the fastest contract was created in 52 seconds! That said, the vast majority of contracts took between 4 and 8 minutes to create. The tail of this metric was held by many statistical outliers that were cut off.
More to come
Future features will bring even more processes inside RPM. For example, a team composition solver is already in the works when mobilizing units. Furthermore, integrated signing will accelerate the deployment by removing traditional paper signing in many jurisdictions.
I hope you enjoyed learning about response times and how we improve our services! If you are an RPM user, you can compare your own experiences with the metrics here. If there are any discrepancies that you wish to address within your organization or your RPM, you know whom to contact.
If you are not yet an RPM user, but would like to get hands-on with rapid and global response as outlined in this post, get in touch!